USER MANUAL
TABLE OF CONTENTS
- 1. INTRODUCTION AND PRECAUTIONS
- 2. DIAGRAMS
- 3. MAIN MENU.
- 3.1. SURPLUS FOR FREQUENCY.
- 3.2. SURPLUS BY REGULATOR.
- 3.3. ORDER SETTING OUTPUT.
- 3.4. SENSOR SETUP LOADING.
- 3.5. SETTING THE TIME AND DATE.
- 4. FUNCTION OF CONTROL OF EXCESS BY REGULATOR.
- 4.1. CHARGE REGULATOR SETTING.
- 5. SYSTEMS FOR POWER CONTROL OF INCREASED FREQUENCY.
- 6. HISTORICAL GRAPHICS
1. INTRODUCTION AND PRECAUTIONS.
Carlotrón is a device designed to harness solar energy surplus in photovoltaic installations with batteries.
This manual is intended for a proper installation and commissioning, as well as instructions for use and operation.
ELECTRICAL SAFETY MEASURES
You need to take electrical safety precautions before starting the installation, ensure that there is no possibility of touching metal parts connected to the mains and the battery terminals. To do this, install the operating switches of each component of the disconnected installation.
CAUTION ON ELECTRICAL LOADS CONNECTED TO OUTPUT CHANNELS
Carlotrón can support up to 2000W power on each channel. Never connect heaters, electric heaters, etc. more powerful than 2000W.
If the connected device, whether a water heater, radiator, stove… has electronic control (displays, LEDs, digital thermostats, …), do not connect directly to the power plug Carlotrón. Only connect devices without electronics, heaters or radiators with analog type thermostat.
To adapt any device with electronic control to use it with Carlotrón, we must make a simple modification that can make it by yourself. To do this, previously contact our technical service.
2. CONNECTIONS SCHEME


3. MAIN MENU
From the main menu, you have access to the main functions, both to set as for normal use Carlotrón.
3.1 SURPLUS FOR FREQUENCY
It gives access to the forwarding feature surplus for power control facilities by increasing frequency and configuration options.
3.2 SURPLUS FOR REGULATOR
It gives access to the forwarding feature for installations with surplus charge controller and configuration options.
3.3 ORDER FOR OUTPUT CHANNELS
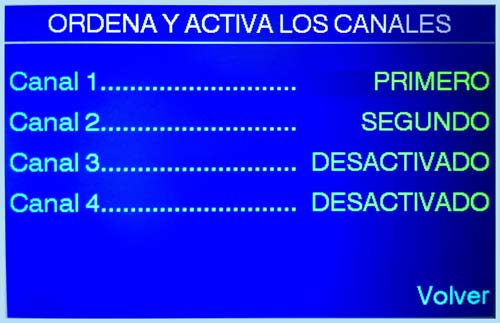

The up / down buttons let you select the output, change the order of the selected output with the left / right keys. Press enter to return to exit.
3.4 CALIBRATION OF INTENSITY SENSOR SETUP
The intensity sensor is necessary to be calibrate in order to obtain intensity measurements as accurate as possible. Follow the onscreen instructions to complete the calibration.
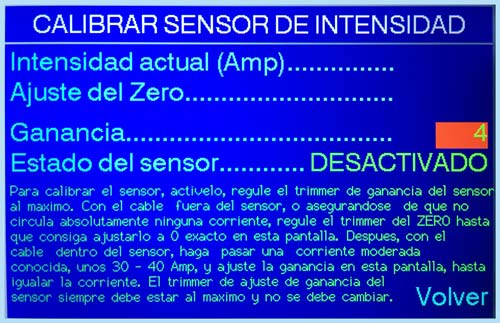

The up / down buttons let you select the output, left and right, change the order. Tap again to exit.

3.5 TIME AND DATE SET UP
The proper time and date must be set up in the system, in order to get a correct logging of the diverted surplus energy. It is important to avoid to set up former dates, since that would erase part of the logging.


Press left / right to move between hours, minutes, day, month and year. Up / Down to change the selected value. Enter to return to exit to the main menu.
4. CONTROL OF SURPLUS ENERGY BY REGULATOR FUNCTION.
On the surpluses bypass regulator screen, three different parts are displayed:
Top-left, bars and power percentage derived per channel.
Lower-left, intensity in real time sensor value; the graph bypass on-off; and average power diverted from the active channels. IMPORTANT NOTE: You must configure the controller before you start using the Carlotrón (See section 3.1).

On the right side of the screen, the following parameters are set:
SURPLUS INCREASED SPEED: Values 1 (slowest) to 99 (fastest). By default, set to 50. Examples:
When a disconnection of 1000W occurs in the installation, immediately produces excess power not utilized, the batteries will not need if they are already loaded, immediately the surplus channel’s power will increase until the total power 1000W surplus according to the set speed.
SURPLUS DECREASE SPEED: Values 1 (slowest) to 99 (fastest). By default, set to 50. Examples:
1000W are drifting from the previous example, and a compact cloud on a windy day is moving and blocking the sun quickly, reducing available solar power. The resulting heat power descends according to selected speed, to be at 0W avoiding battery discharge.
ACCELERATION: -This parameter acts as a multiplier for the previous increase/decrease speed parameters. The acceleration indicates the % amount of increase in each step of the INCREASE or DECREASE SPEED. For example, if acceleration 1 (minimum) increases (or decreases) by 1% every 0.5 sec (depending on speed), acceleration 7 will increase 7% every 0.5 sec. The achieved effect with acceleration is to short the time required to vary the range channel power from one side to another. Another example; if accelerated 1, increased by 1% every 2 seconds, with acceleration 3 will increase by 3% every 2 seconds.
DELAY TO ACCELERATION (seconds): – The time spent since the regulator changed its status until acceleration is activated.
REDUCE SURPLUS WITH INTENSITY SENSOR: Enables or disables the battery charging intensity sensor, with the purpose of power shunt, but the display will continue showing the discharge intensity. Using this option, if it detects any battery discharge while it is deriving power, it is reduced to the necessary measure so that there is no battery discharge.
DISCHARGE INTENSITY LIMIT (Amp): -Maximum discharge (in amps) before intensity sensor acts.
EXCESS REDUCTION DELAY SENSOR (sec) -Time passing since battery discharge is detected, until derived power decrease acts.
INTENSITY SENSOR GRAPHIC: – Access to the graphical real time data display screen of intensity sensor (section 5.0).
TIMES / DAILY / MONTHLY / ANNUAL HISTORIC: – Allows access to records view and historic graphics of harnessed surplus energy (section 6.0)
BACK TO MAIN MENU: – Exit and save parameters, stopping the operation.
4.1 CHARGE INTENSITY SENSOR SETUP
-For OUTBACK regulators, refer to the «Bypass Relay Mode» section (page 41 of the controller manual) and activate it. It is imperative that the regulator is set in this mode for proper operation with Carlotrón.
-For MIDNITE regulators, refer to the section «» (page of the controller manual) and change the relay output Aux1 to WASTE NOT HIGH, with 0.1 sec delay parameters. And pulse width to 0.8 and 1V.
-For MIDNITE KID regulators, please, contact the technic service because it requires a special configuration.
5. SYSTEMS WITH POWER CONTROL BASED ON FREQUENCY CHANGE.
On the frequency bypass surpluses screen, three distinct parts are displayed:
Top-left, bars and percentage of derived power per channel.
Bottom-left derivation and mean power output channels graph, instantaneous values of the real-time frequency (Freq. Real), average of set readings number (Freq. Media) to be considered for the power derivation, and the instantaneous intensity load value.

On the right side the following parameters are configured and displayed:
BASE FREQUENCY (HZ). Nominal frequency value of the installation, when there are no surpluses, usually 49.99 or 50.00 Hz. This value can normally be seen in the inverter network parameters.
HIGHER FREQUENCY SURPLUSES (HZ) Frequency value from which begins to derive surpluses, should ideally be the same that has set the inverter network as the beginning of power reduction.
HYSTERESIS FREQUENCY OF SURPLUSES (HZ) difference between the initial frequency surplus value and frequency which power begins to drift. This value will always be lower than the surpluses initial value, and -0.03 by default.
Only may be decreased if during normal operation of the Carlotrón, the power deriving value of the average frequency exceeds steadily the initial frequency surplus value. Taking the example values of the image, the average frequency must be oscillating around 50.17 Hz (the difference between surplus and start Freq hysteresis value) and rarely exceed 50.20 Hz. If the frequency continuously exceeded the 50.20 Hz while power is drifting, this parameter has to be lowered.
FREQUENCY OFFSET READING (hz): frequency difference value measured between Carlotrón and the network inverter. It is used to match the read frequency values with those read by the investor.
RISE RAMP START DERIVATION (s): Time in seconds it takes to increase the derived power from 0% to the corresponding value, when it enters the surplus frequency function from the main menu.
WAITING TIME WITHOUT SURPLUSES (s) and RESET TIME WITHOUT SURPLUSES: These two parameters prevent that energy is derived without having surpluses. This can happen when at night or at times when there is no surplus energy (cloudy for example) a significant consumption is disconnected in the installation, which causes rapid and short increase in the frequency that if not leak, it would cause small peaks of derived energy to the first channel. Only change the value of these parameters if you notice that at evening, power is derived for short time intervals when disconnecting a high consumption.
To verify this, do the following test:
At night, keep the inverter operating at +/- 10% of its nominal power (example 300W). Connect a consumer until 90-100% of the nominal inverter power (3000W) for a few seconds and disconnect it. When disconnected, the frequency may increase for a few seconds. If it gets to cause the first channel begins to derive power, increase the reset time parameter without surplus for a second. The waiting time without surpluses parameter determines the time that must elapse since energy surpluses have ceased in order to the reset time without surpluses parameter is again considered; for example, is useful if an appliance such as an oven turns on and off a resistance every 150 seconds that causes the phenomenon described above. In this case, we should increase the value of this parameter to a minimum of 150 sec.
Do not change either of these default values unless necessary.
SURPLUSES INCREASE SPEED: Value of 1 (slowest) to 99 (fastest) by default 50. Example:
-When a consumption of 1000W disconnects in the installation, immediately a power excess not exploited is produced, the batteries will not need if they are already charged, immediately the channel surpluses power will increase until the total of 1000W remaining, depending on the set speed.
SURPLUSES DECREASE SPEED: Value 1 (slowest) to 99 (fastest). By default, set to 50. Examples:
– 1000W are drifting above previous example, and a compact cloud on a windy day progresses blocking the sun quickly, reducing available solar power. The resulting power to heat lowers depending on the set speed, until it descends to 0W, avoiding battery discharge.
ACCELERATION: -This parameter acts as a multiplier for the previous increase/decrease speed parameters. The higher the value of acceleration, speed increases exponentially in both cases. The value can range from 1 (linear increase) to 9 (very exponential increase). The achieved effect with acceleration is to short the required time to vary the power range channel end to end.
FREQUENCY GRAPHIC: With this option, a graph is displayed in real time, the average frequency with the actual frequency. On the Y axis of the graph, the values of FE (Frequency at which they begin to derive surplus) and FB (Frequency Base installation) appear. These two values would change in the graph depending on the parameters set in the frequency surpluses main menu.

BATTERIES INTENSITY GRAPHIC: – Access the graphical display of data in real time of the intensity sensor (section 5.0).
TIMES / DAILY / MONTHLY / ANNUAL HISTORIC: – Allows access to view historical records and surplus energy harnessed graphics (section 6.0)
BACK TO MAIN MENU: – Exit and save parameters stopping operation.
6. INTENSITY SENSOR GRAPHIC.
By intensity sensor graph, it is possible to display the charge and discharge intensity, it can be useful to check the correct operation of Carlotrón system when excess power is drifting. Move through the options of the graph using the left / right buttons, and change the display using the up / down. Press the enter button at any time to exit.

7. SURPLUS ENERGY HARNESED HISTORICAL RECORD
Carlotrón provides a record of all surplus energy harnessed over time. It is possible to view the energy for a full day in time zone sections, as well as full days, months or years. It is always possible difference over the total energy used by all channels in total, or each channel separately.
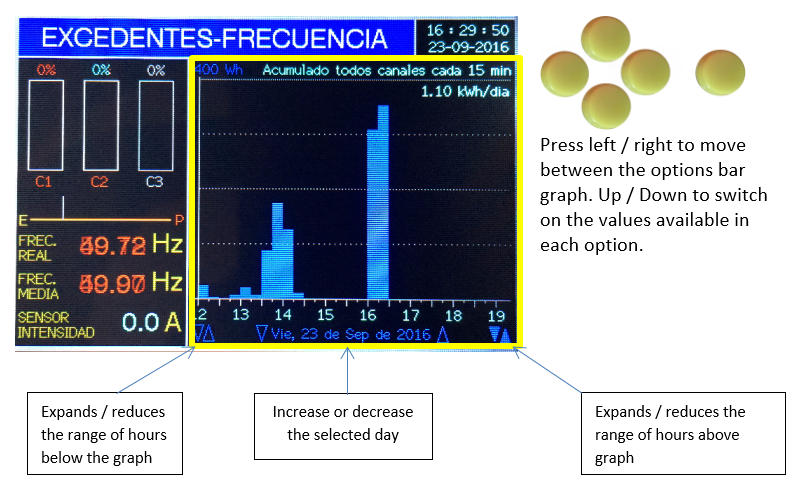
TIMES HISTORIC: This option can be displayed in bar graphs, in sections of 15 minutes up to ten days ago, the surplus energy harnessed in total from the channels.
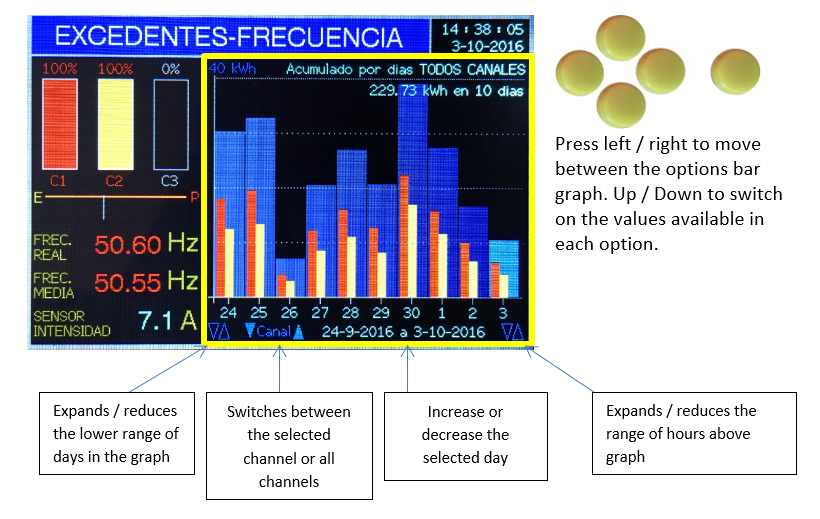
NEWSPAPERS HISTORICAL: This graph represents the harnessed excess energy used by each channel, during each day.
MONTH HISTORICAL: With this option, it can be displayed in bar graphs, in sections of one year and up to ten years ago, the harnessed surplus energy in the total channels.
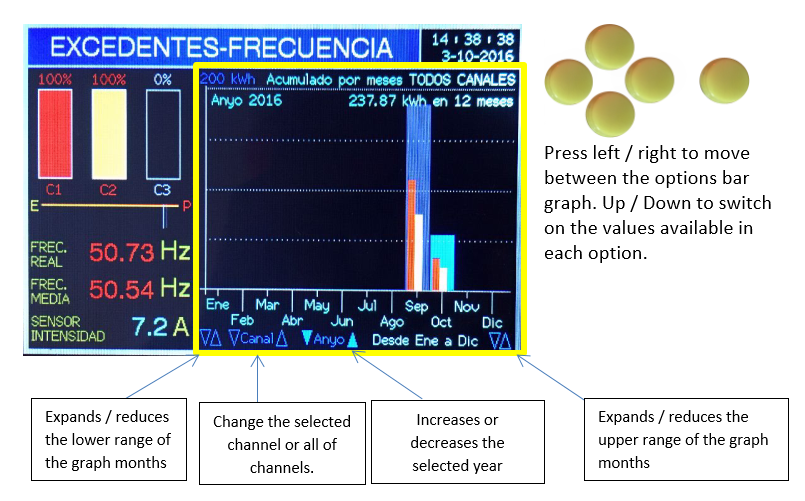
YEAR HISTORICAL: With this option, it can be displayed in bar graphs, in sections of one year and up to ten years ago, the harnessed surplus energy in the total channels.

 Conectado - Chatea con Nosotros